We at WeatherExtreme like to keep tabs on our local weather. We’re all meteorologists, after all, so it just can’t be helped. When we heard reports that an EF-0 tornado was spotted just outside of Sacramento, we were very intrigued and decided to take a closer look.
Tornadoes in California’s flat and expansive Central Valley are not particularly uncommon. The state averages about 11 per year, with a majority of them concentrated in the northern half of the valley. Our tornado in question is located outside of this range, south of Sacramento near a town called Galt.
The first part of investigating weather phenomena is getting a sense of scale: where did it happen? What time did the event start? When did the event dissipate? We first looked at the local storm reports (LSRs) collected by the National Weather Service office in Sacramento to get an idea. One LSR gave us some good starting points, a road intersection where the tornado was spotted, and even some exact coordinates. We were able to pinpoint the tornado to this general area:
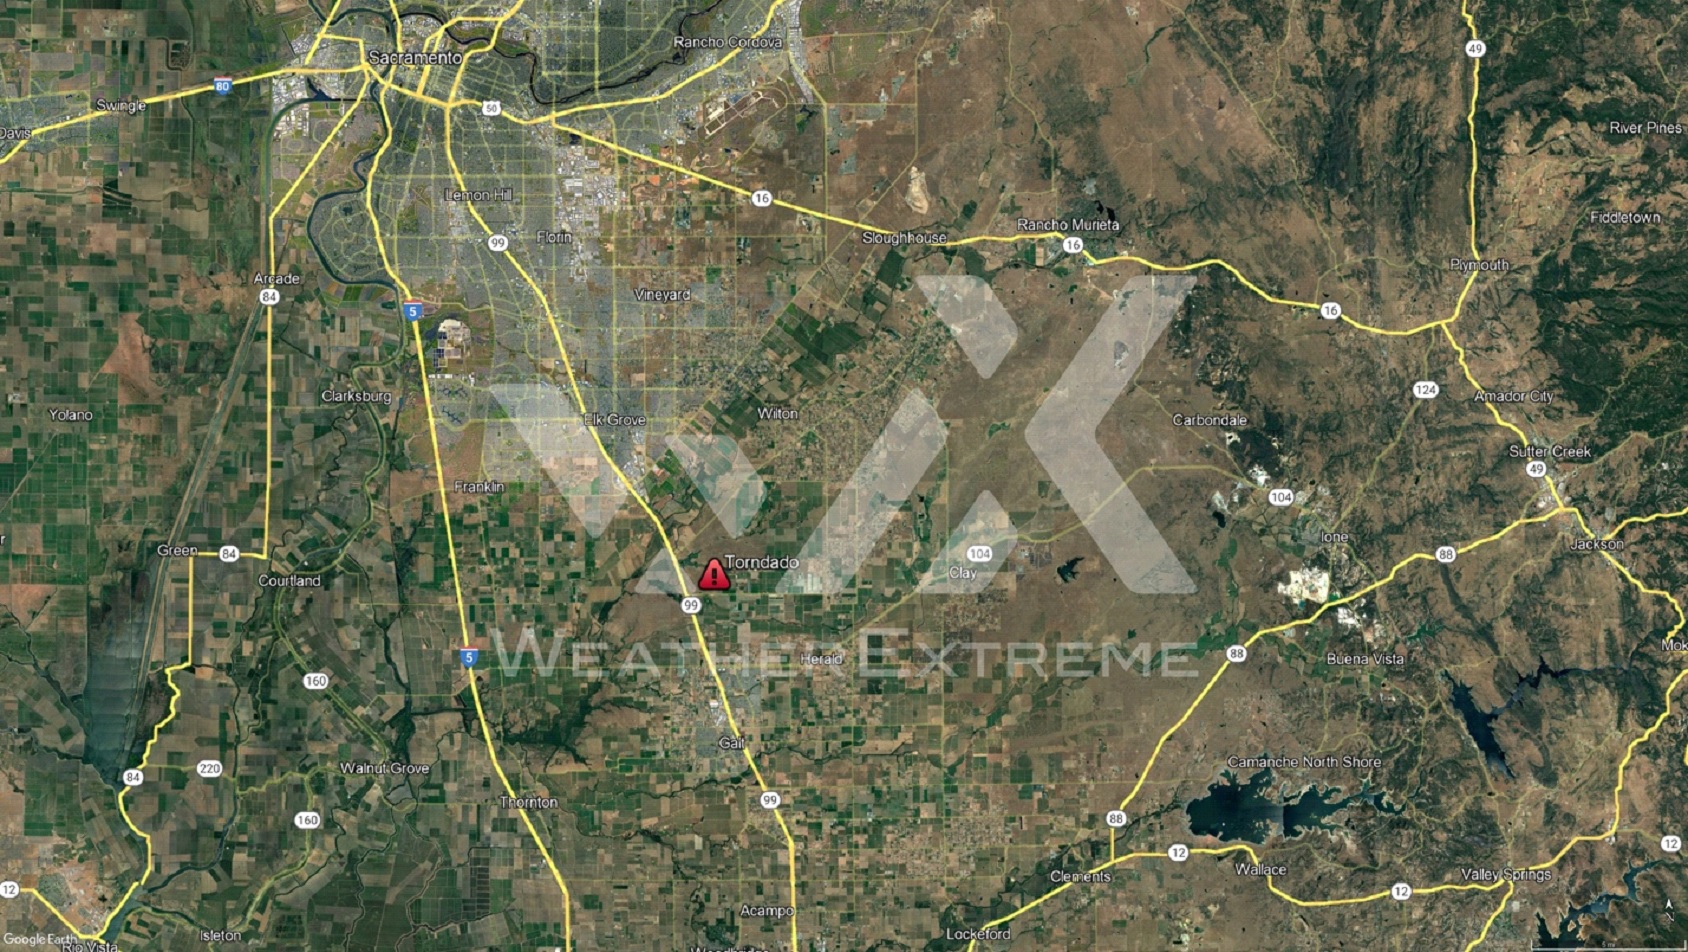 The LSR even gave us some estimated information about the tornado like its wind speed and path length, but these are very important to verify with the tools that we have.
After we have an initial location, the next step is to start gathering data about the event. The most important data source in this case is the Weather Service’s NEXRAD (stands for Next Generation Weather Radar) radar. Radar is probably the most important tool in the tornado chaser’s toolbox, as it often allows you to easily see the presence of the tornado and make calculations about its strength/movement. It’s also important to get other data in order to complete the picture, so we also took a look at the surface observations and satellite images taken at that time.
Next comes the fun part, the analysis! Our team of highly qualified scientists bring with them very specialized expertise in this area, so they were able to make quick work of the data. Using the NEXRAD radar data, they were able to find multiple signatures of the tornado:
The first panel shows something known as a “hook echo,” (highlighted in the image with a comma-like shape) which shows a rotating cyclone (the tornado) breaking away from the main storm core, creating a sort of “hook” shape as it rotates.
The second and third panels both relate to the velocity of the storm toward the radar, with green showing areas that are moving toward the radar, and red showing areas that are moving away. The signature to look for here is the “velocity couplet”, an area of red and green that are both very close to each other. You can see this circled in white in the above images, with arrows denoting the direction of rotation in this case. Since storms typically move in one direction, this area of internal rotation is an extremely good signature of a tornado.
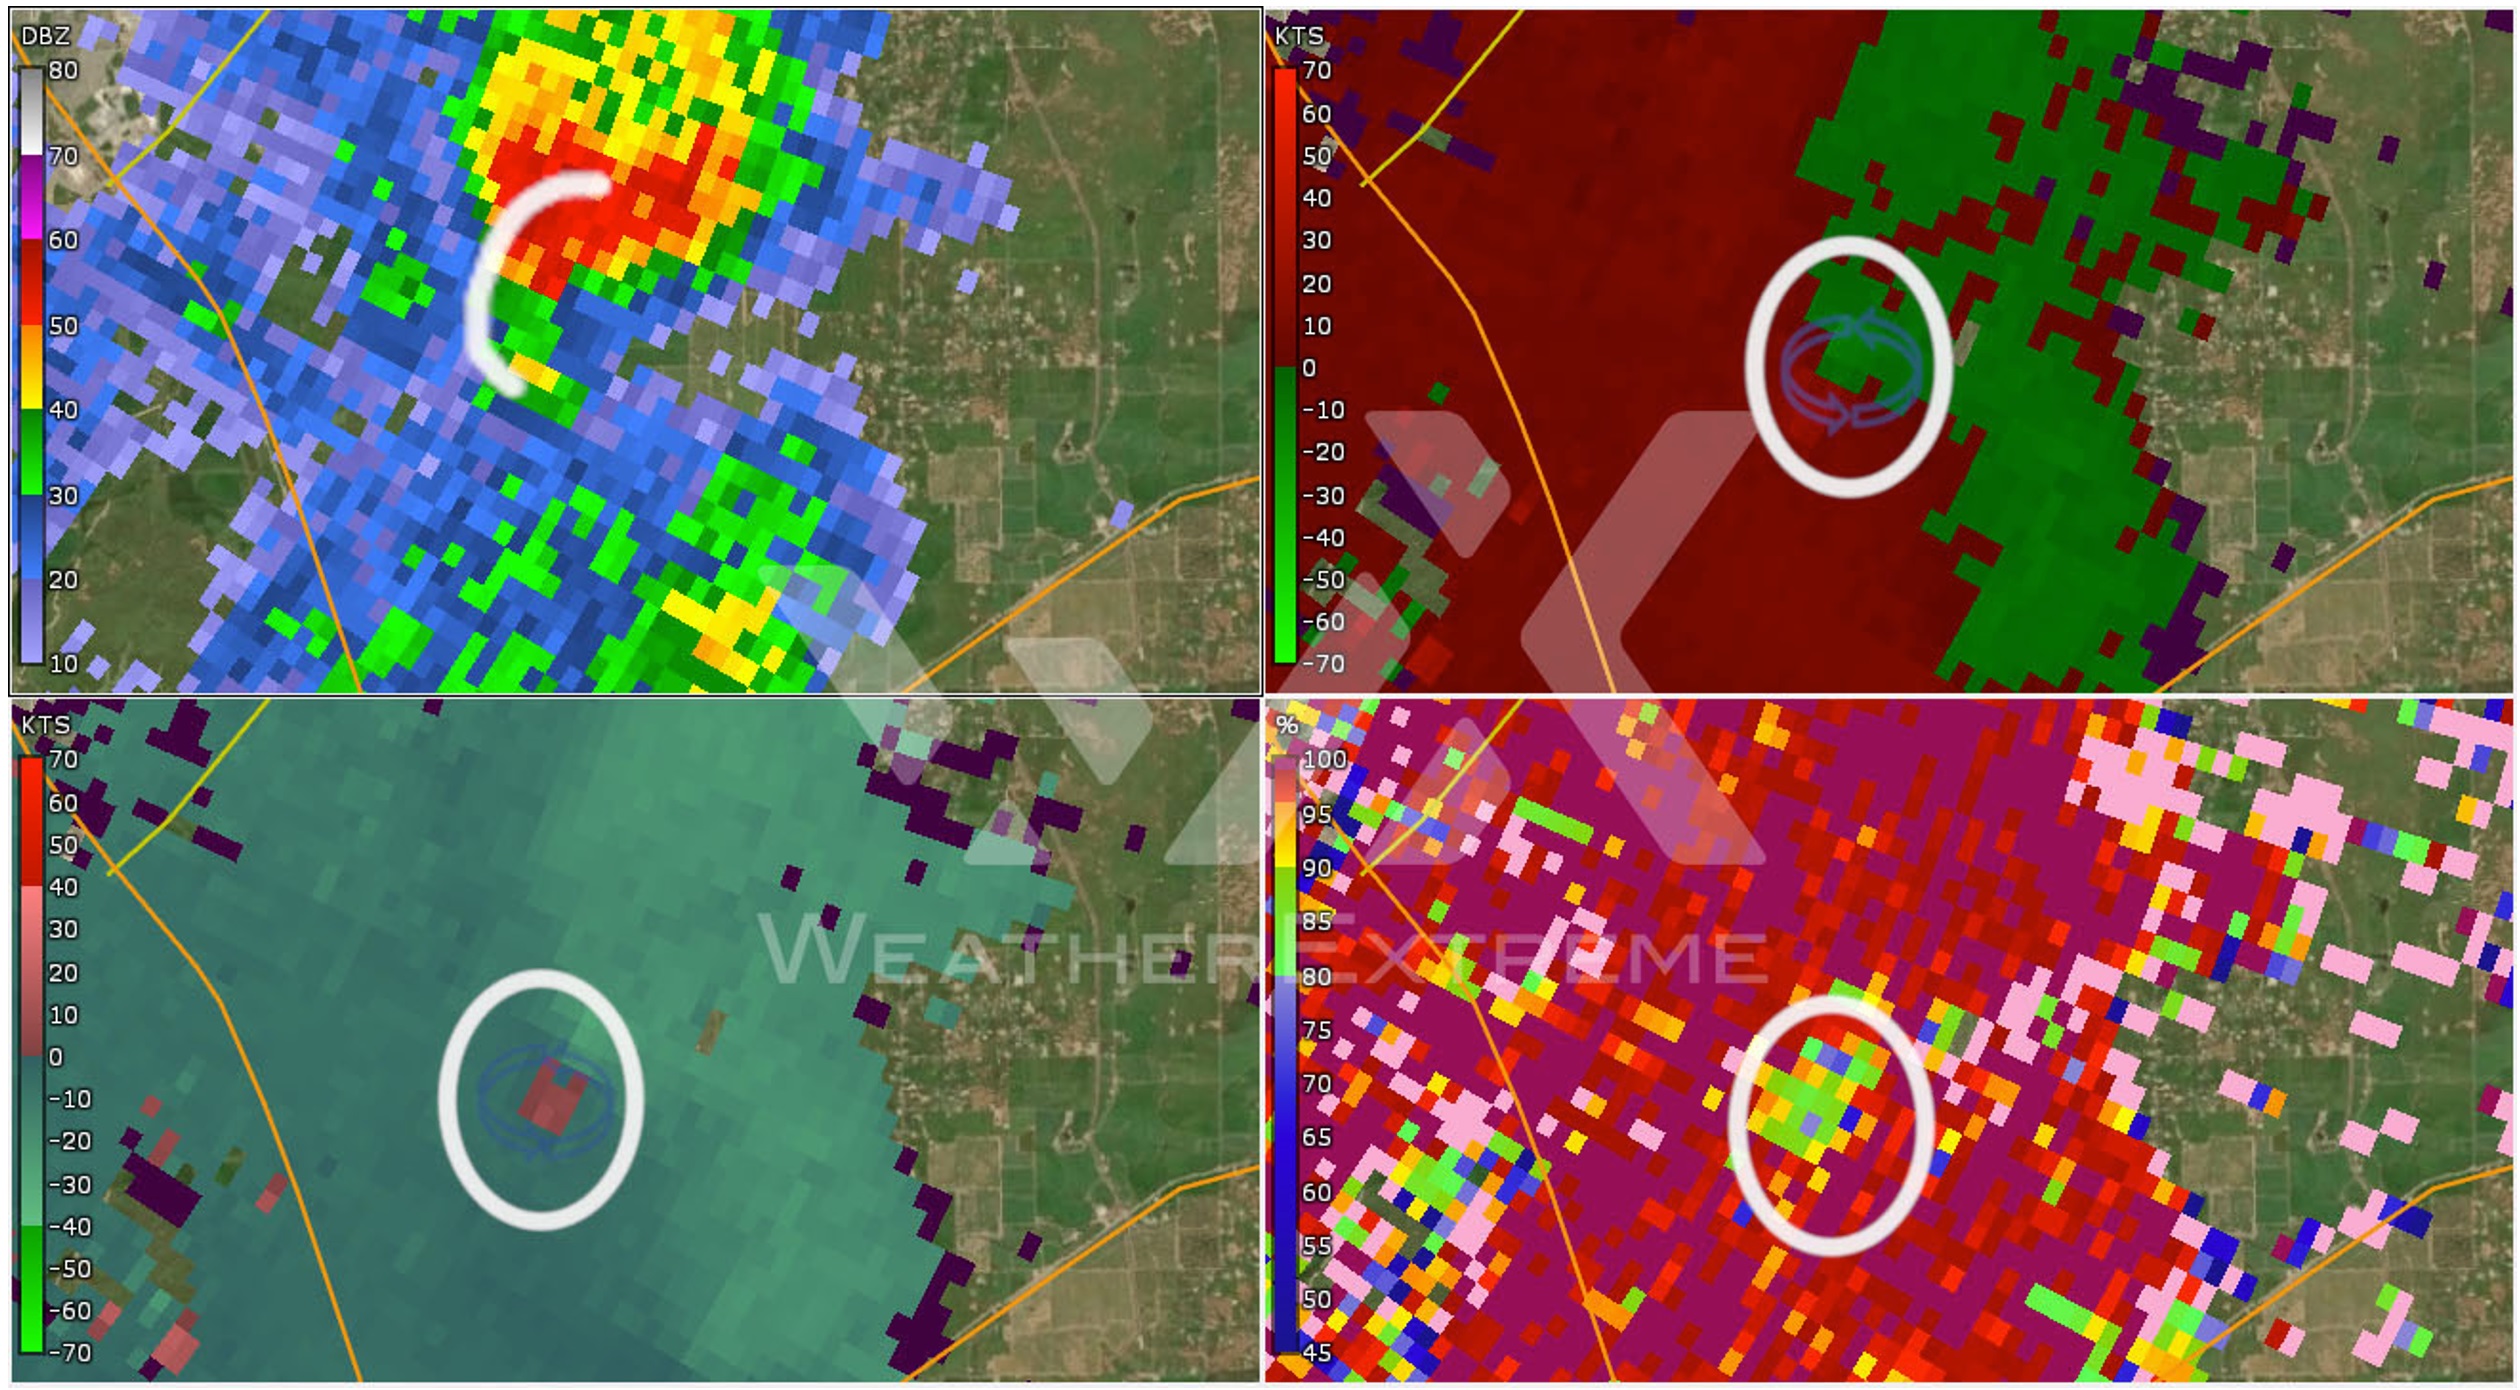 The last panel is a product known as the Correlation Coefficient. This relates to what types of radar “targets” exist in the scanned area. Reds and pinks (indicating a very high correlation coefficient) indicate close to 100% water in the scanned area, while greens, yellows, and blues can represent targets that are not meteorological (bugs, dust, smoke, etc.). An important exception to this rule is frozen precipitation like hail and snow, which could have been a factor in this cold winter storm. However, this highlighted area is likely to be returns from the tornado, let me explain. When a tornado starts spinning up, it can start to collect dust and other debris from the ground. This debris does not typically have a significant water content to it, and therefore it usually shows up as a blob of lower correlation coefficient (meaning less water content in the scanned area).
Using our tools, the amazing scientists at WeatherExtreme were able to verify that a tornado did in fact take place in the reported area. We were also able to find that the tornado was in a different location than originally reported, likely further east than the report specifies. We were also able to analyze the large-scale (synoptic) conditions for that day and determined that it was a very conducive environment for convective activity to take place, including possible tornadoes.
Thanks to everyone on our team who helped with this analysis, especially Jim P., Brad, and Patrick! If you liked this analysis, check out our website to see what WeatherExtreme can do to help you or your business with your specialty forecasting and weather reconstruction needs. https://weatherextreme.com